
The Mapping Grid
DatMapR generates maps based on an orthogonal grid such as the UK Ordnance Survey National Grid (OS NGR). Though some functions within DatMapR assume that the mapping relates to the OS NGR grid, in practice, the axes can refer to any orthogonal (X/Y) grid, such as Longitude/Latitude or another local grid system.
Mapping Mode
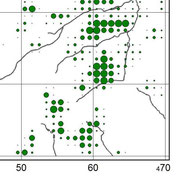
The data can be mapped in 'Grid' mode, with a limited amount of data aggregation (Sum, Average, Max, Min, Count and 'Count Discrete') being done within DatMapR, the results being plotted by grid square.
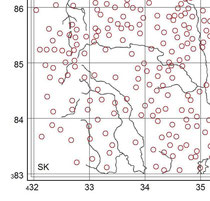
Alternatively, individual records can be plotted at the specific location given in the record ('Exact' mode) with no aggregation.
Source Data
Source Data can be 'records' of individual observations (e.g. sightings of particular species), statistical data relating to grid squares (e.g. land use, population, etc.), simply a list of locations, or any other data which includes a location as an OS NGR string (e.g. SK123456) or as grid coordinates.
The data to be mapped needs to be imported into a DatMapR Project file, and can be provided as text records in a fixed format (data fields in fixed character positions), or delimited by special characters (generally commas or tabs, but others are accepted). These could have been created manually, or from an Excel spreadsheet, an Access database, or a variety of other software packages. Any complex pre-processing (e.g. calculating ratios) would need to have been done in the source system - DatMapR is designed to map the data, though a limited amount of aggregation and selection can be done by the software.
Location Data Formats
A parameter can be set within the Project file to note that the data is based on the UK Ordnance Survey National Grid (OS NGR) (or not).
If the project is based on OS NGR, each record will generally include a location provided as a single field in OS NGR format (e.g. SK123456) which can be in any position within the record. Variations within OS NGR are accepted, including varying precision references from 100km to 1m (e.g. SK to SK1234567890), 2km 'tetrads' using the 'DINTY' suffix (e.g. SK12G) or a 5km grid (cf. OS 1:10,000 map tile numbering (e.g. SK12NE)). The 'precision' of the imported NGRs are stored in DatMapR and can be used to select or exclude records from the mapping.
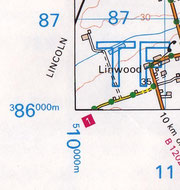
If the Project is based on OS NGR, the location data can alternatively be provided as two fields holding Eastings and Northings as numeric values. Again these can be in any position within the records. These Eastings/Northings values MUST then be provided as 1km values based on the full OS NGR grid (e.g. SK123456 is equivalent to Eastings 412.3, Northings 345.6, i.e. including the 100km values for the ‘SK’ 100k square). These values can be seen at the margins of Ordnance Survey maps.
(NOTE - To be perfectly ‘correct’, the full OS references should be given using one metre values (i.e. TF100860 = 510000.0, 386000.0, as seen at the corner of the above example), but early versions of DatMap were written to handle data extracted from the UK Countryside Information System and other sources which use 1km values. This convention has been retained in the current version!)
If the Project is NOT based on OS NGR, the ‘Eastings’ and ‘Northings’ can be on any scale convenient to the purpose. Facilities using OS NGR will not then be enabled in the user interface.
Data Fields
As well as location details, each record will include Data Fields which, within DatMapR, can be treated as either 'text' (e.g. Species Name, Recorder, etc.) or 'numeric' (e.g. Year, Land Use Statistics, etc.) - This affects how data is sorted, how it can be used in selecting records, and how values can be aggregated (e.g. a text field can be counted but not summed). All data is held at text and the text/numeric flag can be toggled as required without having to reload the data.
(NOTE - In the current version, Date values cannot be handled by DatMapR, they therefore need to be treated as text or as a simple numeric value, e.g. Year, any pre-processing being done outside DatMapR, e.g. in Excel)
Up to 10 such Data Fields can be imported into the DatMapR Project file. Maps can then be based on any one of these fields and a sub-set of records can be selected for producing each map on the basis of up to four fields (e.g. mapping may be based on Species Names, selecting only records where Year is greater than 1990).
Further source files can be loaded into a same project file, the data being replaced or appended.
Data Bands / Categories
The data can be plotted using a variety of symbols of specified sizes and colours (see below) in up to 15 bands or categories, though by default, all of the selected data will be mapped using a single symbol - effectively using a single band.
Where separate bands or categories are needed in a single map (e.g. to map different species or ranges of values), the bands are defined by the data values held within the data field being mapped (optionally aggregated if in ‘grid’ mode - e.g. 'Count of Species' >=0, >=10, >=20, etc.). By default, each band includes values above a 'base' value (and by implication below the base of the next band).
This assumes that the values in the bands are to be treated in ascending order and that the bands are contiguous. DatMapR does however allow wide variation in the definition of the bands - each band can have a 'base' and a 'limit', the boundaries can include or exclude the boundary values (e.g. >50 or >=50), and the bands need not be in ascending order.
Bands for text data fields will be defined using normal ASCII sorting (effectively alphabetic, 0-9 then A-Z then a-z – ‘ABCD’ will therefore be ‘less than’ ‘abcd’)), but the user can choose to ignore the 'case' (‘ABCD’ will then be ‘equal to’ ‘abcd’). Bands for Numeric fields (and 'counts' of text fields) will be based on numeric values.
Mapping Symbols
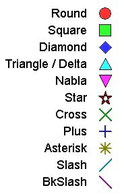
Mapping Symbols can be defined from a list of 11 'shapes' shown on the right. They can be drawn as a coloured outline, or with a solid fill (which can itself have a black hair-line outline as shown here). They can also be of varying size and colour.
For 'grid' mapping, the grid squares used for the mapping are of a user defined size which also defines the symbol size range available. For 'exact' mapping, the equivalent parameter defines the maximum symbol size. These sizes are specified in terms of the data units (i.e. 1km for data to be treated as OS NGR).
As well as the 11 pre-defined Symbols, each map can also use up to three 'Icons' defined by the user. These can be based on user provided image files.
Background / Overlay
A background image can be defined to provide a base map, background logo, or colour field. The 'background' can optionally be placed over the mapped data as a transparent overlay - white pixels in the image will be treated as transparent. Background images could be hand drawn, or obtained from a source such as the Ordnance Survey's Opendata site.
Other Formatting
The user can also define the geographical area covered by the map, the size and resolution of the generated map, text for map titles and subtitles, the spacing of grid lines, the position of a symbol key, fonts, text and line colours, etc.
Saving Settings
The parameters defined for the mapping can be saved as part of the Project file as a series of 'sets' and 'sub-sets' which can also be re-loaded in any combination as required - e.g. reloading the full map details from one saved 'set', symbol details from another, and a new background from a third 'set'.

